About Client
The client is a global event management company headquartered in Chicago, with operations across the Americas, Europe, and the Middle East.
Challenge
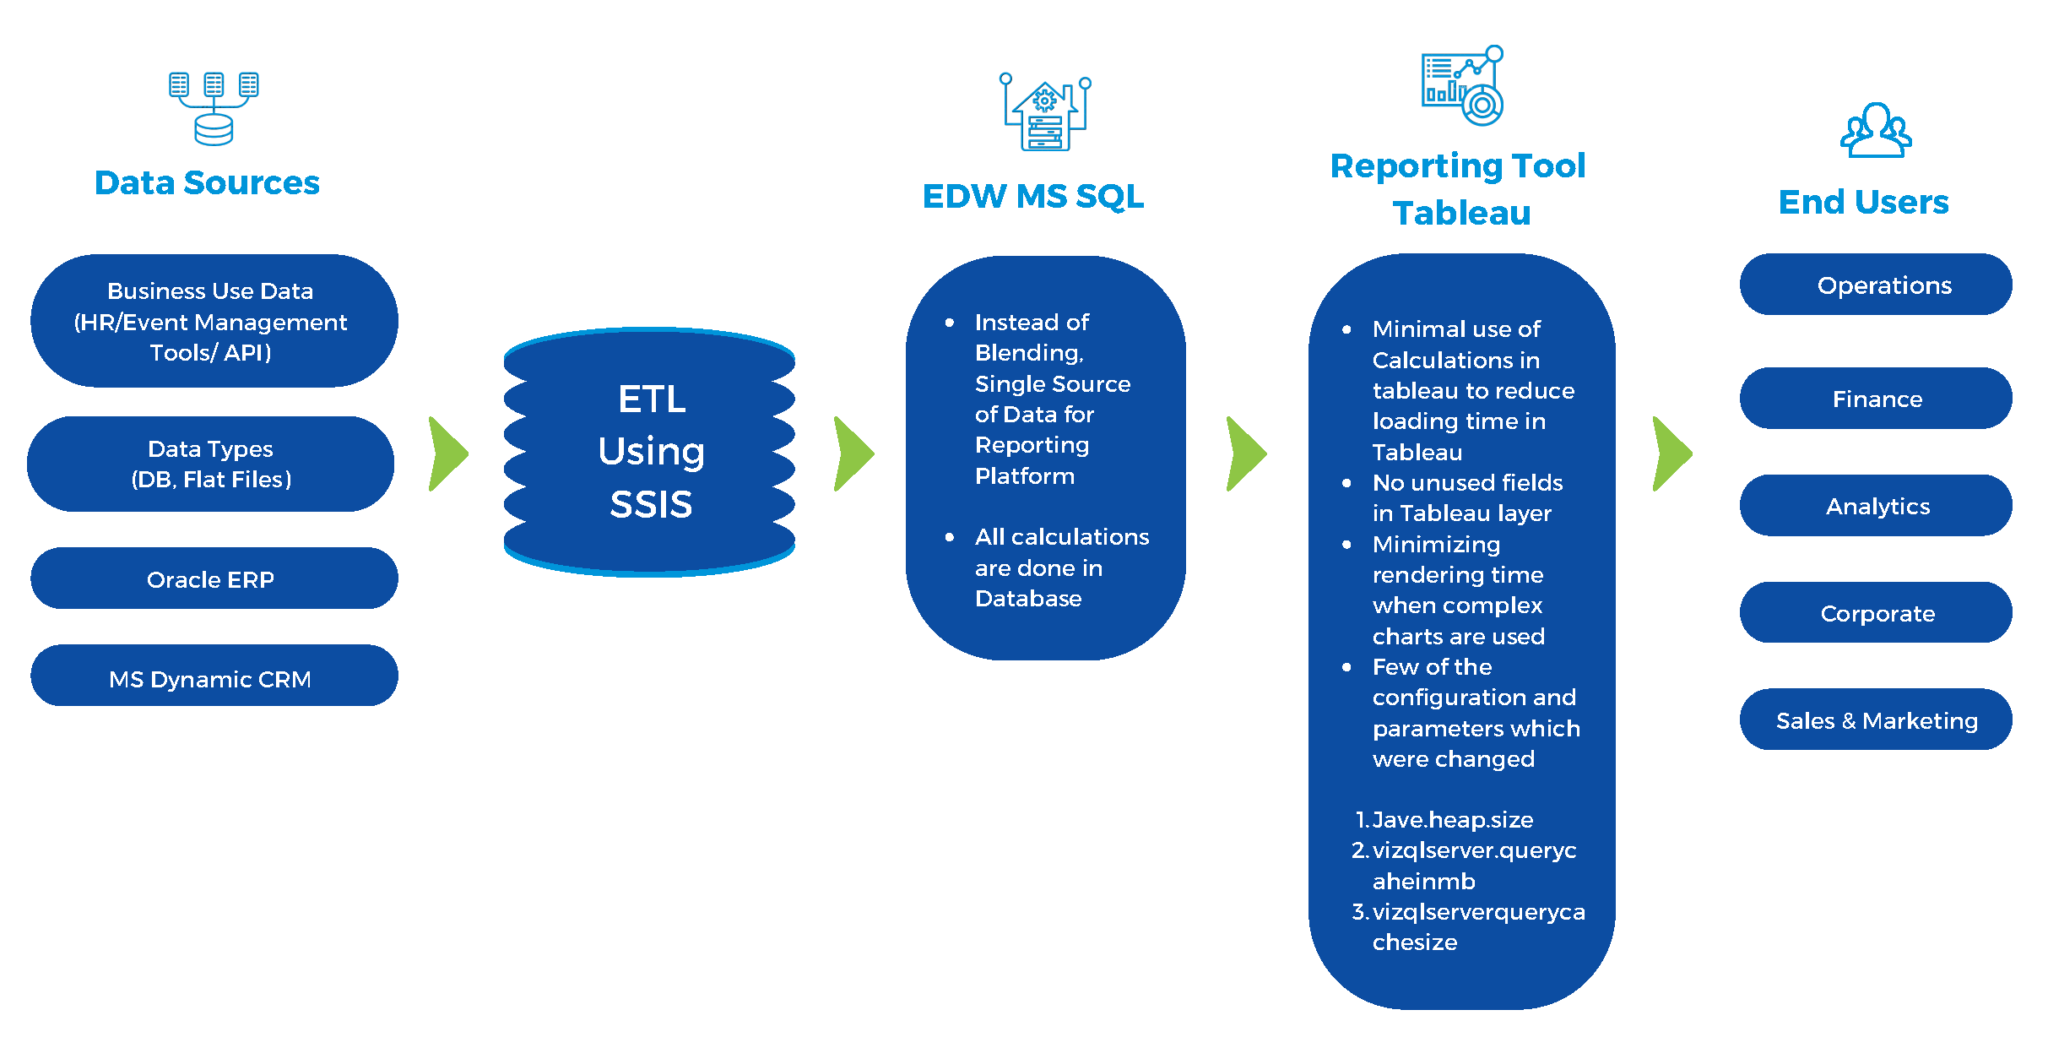
The client faced persistent usability issues due to poorly optimized Tableau dashboards. These Tableau reports were accessed concurrently by nearly 1,500 business users across the organization, causing severe performance degradation.
As concurrency increased, report generation slowed significantly, reducing trust and adoption of Tableau dashboards. The primary requirement was to bring down report response times to restore usability and enable organization-wide consumption.
The problem was compounded by unoptimized hardware running on legacy servers, along with constraints introduced by a shared virtualized infrastructure. Together, these factors made Tableau dashboard optimization critical for sustaining enterprise-scale usage.